Click-Through to Reports #
When viewing Dashboard statistics, it can be useful to see the source data that the statistic is calculated from. For example, seeing which calls were lost or looking at why the service level has dropped.
This is where 'Click-Through' comes in. Any tile which is built using completed call data supports clicking directly through from the tile to a report which displays the data used for the tile. This concept is easy to use and reduces the time required by users to investigate performance and customer experience issues.
tip
Click-through is only available on statistics with data on completed calls. If there is no click-through options, it means the statistic is calculated with live call data and so is not available in a report.
Single Stat or Chart Click-Through #
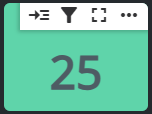
The 'Click-Through' icon is visible on any tile that supports the feature, just hover the mouse over the tile to see the menu:
![]()
Clicking on the icon will open a report showing the data used to calculate the statistic.
Multi-Stat Click-Through #
On a multi-stat tile, selecting click-through will open a sub menu from which you can select the statistic you would like to see the report data on:
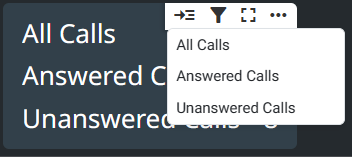
info
If some of the statistics on the multi-stat tile are calculated using live call data, they will not appear in the click-through sub menu.