Dashboard/Wallboard #
Dashboards & Wallboards provide access to call and user statistics in an easy to consume way, showing data for the day which either updates at the end of a call or during a call when combined with Live Analytics access.
By displaying information on calls that are still active, managers/supervisors have the ability to react and help ensure that service level commitments are met.
info
Wallboard views update in near real time. Call information is processed as it is received from the communications platform and then passed to open views in 2 second intervals. Delays in events being received or in processing can introduce small delays in view updates.
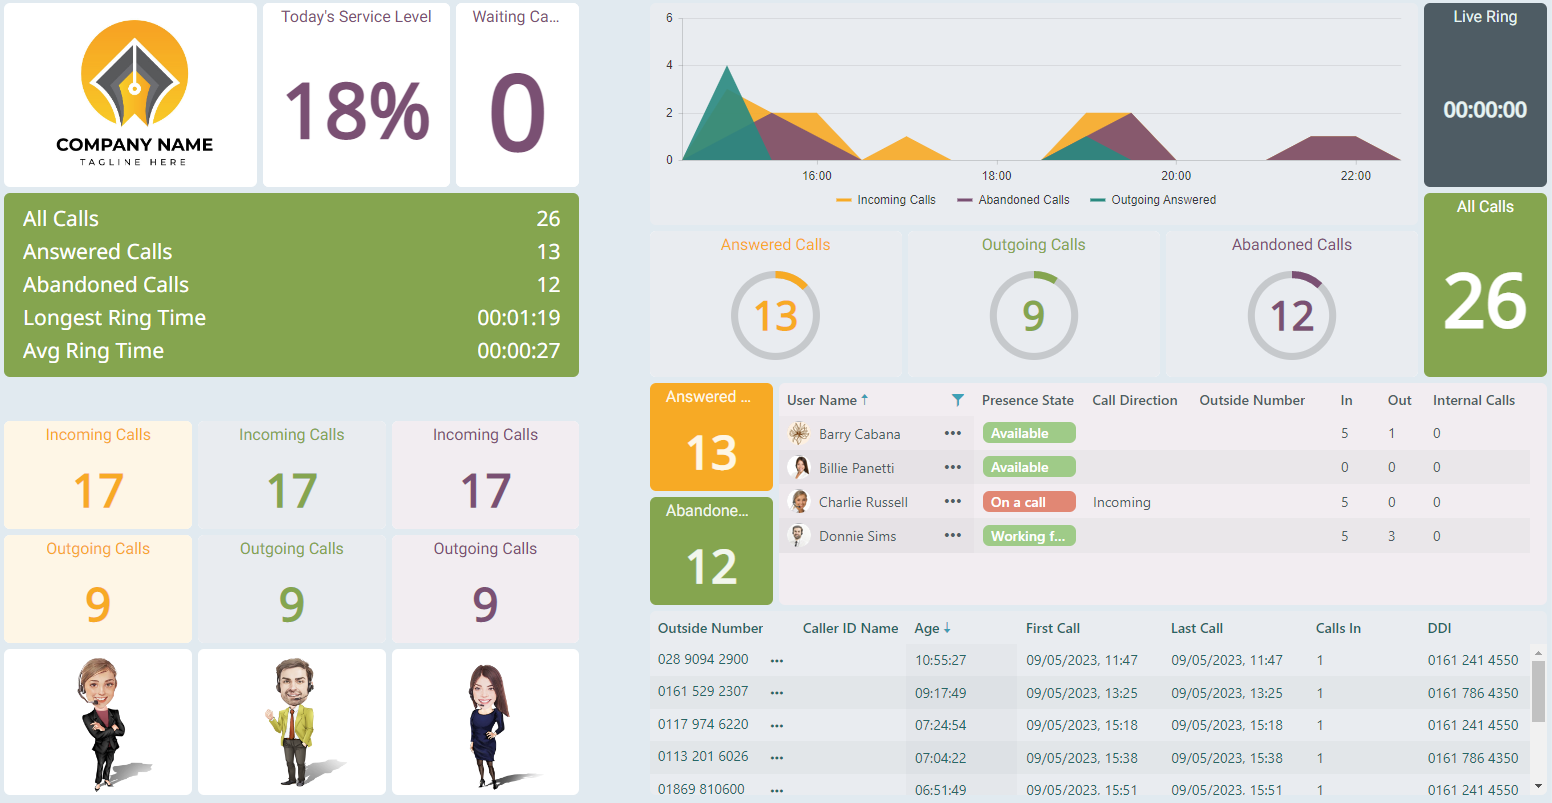
Dashboards #
Dashboards are designed to be used from a desktop by supervisors, team leaders or other management. They provide an intuitive and fully customizable look at communications and where applicable, provide the user with active control over calls and agent status.
Wallboards #
Wallboards are designed to be viewed on a large screen for multiple people to see. They provide a large range of statistics which can be filtered to show information for specific groups of people or DIDs.
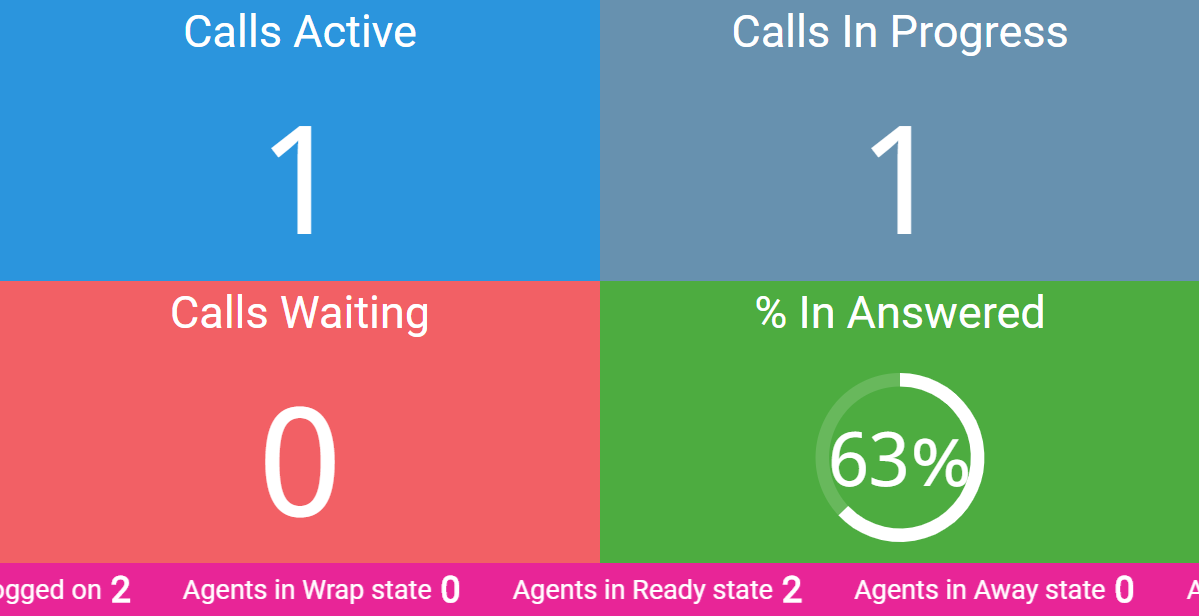
Up to 64 tiles can be added to a wallboard view, each with a different statistic and filter. Each wallboard view is automatically sized in a grid, making it easy to add and manage tiles.
Wallboards can be displayed through a supported browser or using the dedicated Wallboard application for Amazon FireTV.
Refer to the Requirements section for more information on browser and FireTV requirements.
warning
Browsers will often put Tabs to sleep if they are not active or the browser has been minimized. This can cause Dashboards/Wallboards to stop updating and also require them to completely reinitialize when activated.
Please check the settings of your specific browser to ensure the ~.Dimensions.~ is configured to bypass this.
Live Data #
When accessed with an appropriate user role, Dashboards & Wallboards can display information on 'Live' calls, these are call that are in progress and have not yet been answered or completed.
Having access to live data provides users with the ability to make service level affecting changes, actively improving customer experience instead of just reporting historically.
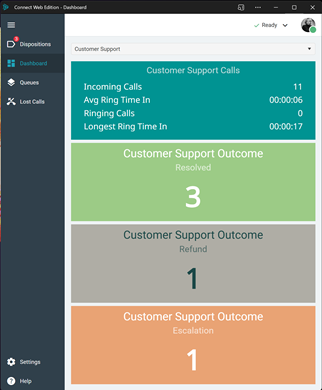
Personal Dashboards #
Personal dashboards are designed for use by individual users of the phone system so that they can view their own communications usage and if necessary track their own performance against KPIs.
The Personal Dashboard also includes access to a queue grid which shows the current status of queues that the user is a member of and an unreturned calls grid so that users can see details of customers that have outstanding requests.
User Access Levels #
The following table shows the features that are available within the solution for each supervisor level:
| Supervisor Levels |
Dashboard / Wallboard Access |
Tile limit |
Filtering | User Grid | Queue Grid | Live Call Data |
Agent Grid | Call Interaction | User Interaction |
|---|---|---|---|---|---|---|---|---|---|
| Reports | ✘ | N/A | N/A | N/A | N/A | N/A | N/A | N/A | N/A |
| Insights | ✔ | 16 | ✘ | ✘ | ✘ | ✘ | ✘ | ✘ | ✘ |
| Analytics | ✔ | 64 | ✔ | ✔ | ✔1 | ✘ | ✘ | ✘ | ✘ |
| Live Analytics | ✔ | 64 | ✔ | ✔ | ✔1 | ✔ | ✘ |
|
✘ |
| Contact Center | ✔ | 64 | ✔ | ✔ | ✔ | ✔ | ✔ |
|
-
The Queue grid is available using an Analytics/Live Analytics Supervisor role, but the active call stats and queue state fields are restricted to the Contact Center Supervisor role. ↩︎
-
Not all call interaction features are available on every telephone system. For more information, view the Platform feature matrix. ↩︎