Tile Types #
The following table shows the types of tile that are available, what sort of data they can display and which license they are supported on.
| Tile Type | Data | Limits | Filtering | Dashboard | Wallboard | License |
|---|---|---|---|---|---|---|
| Single Stat | - Aggregated (Totals/Averages/Percentages) - Minimum/Maximum Values - Manual Text |
N/A | ✔1 | ✔ | ✔ | - Insights - Analytics - Live Analytics - Contact Center |
| Circular Gauge | - Aggregated (Totals/Averages/Percentages) - Minimum/Maximum Values |
N/A | ✔1 | ✔ | ✔ | - Insights - Analytics - Live Analytics - Contact Center |
| Cycle | - Aggregated (Totals/Averages/Percentages) - Minimum/Maximum Values - Manual Text |
2 Stats | ✔1 | ✔ | ✔ | - Insights - Analytics - Live Analytics - Contact Center |
| Multi-Stat | - Aggregated (Totals/Averages/Percentages) - Minimum/Maximum Values - Manual Text |
N/A | ✔1 | ✔ | ✘ | - Insights - Analytics - Live Analytics - Contact Center |
| Stats by Time Chart | - Limited call data fields | N/A | ✔1 | ✔ | ✘ | - Insights - Analytics - Live Analytics - Contact Center |
| Unreturned Call Grid | - Unreturned abandoned calls with specific call information. | 1 / view | ✔1 | ✔ | ✘ | - Insights - Analytics - Live Analytics - Contact Center |
| User Grid | - Summarized Call & Status data2 by User | 1 / view | Users / User Groups Only |
✔ | ✘ | - Analytics - Live Analytics - Contact Center |
| Agent Grid | - Summarized Call & Status data by Agent | 1 / view | Users / User Groups Only |
✔ | ✘ | - Contact Center Only |
| Queue Grid | - Summarized Call & Status data2 by Queue | 1 / view | Queues Only | ✔ | ✘ | - Analytics3 - Live Analytics3 - Contact Center |
| Image | - Browser Supported Image Format | N/A | N/A | ✔ | ✔ | - Insights - Analytics - Live Analytics - Contact Center |
| Ticker | - Aggregated (Totals/Averages/Percentages) - Minimum/Maximum Values - Manual Text |
1 / view | ✔1 | ✘ | ✔ | - Insights - Analytics - Live Analytics - Contact Center |
| Video | - MP4 Video | 1 / view | N/A | ✘ | ✔ | - Insights - Analytics - Live Analytics - Contact Center |
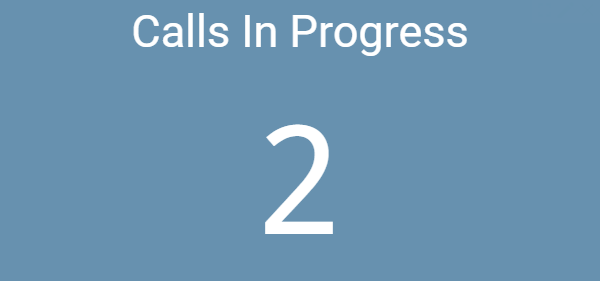
Single Stat #
One or more of these tiles can be added to a view. Each tile can show a single statistic field at a time and can have it's background/text color customized as required.

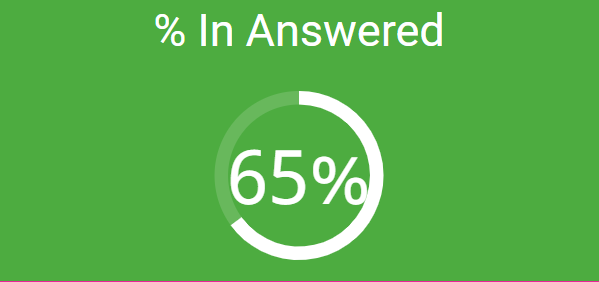
Circular Gauge #
One or more of these tiles can be added to a view. The field chosen is displayed within a circular gauge. The fill level of the gauge is calculated using the 'Max Value' property of the tile. By default this is set to 100 (for use with % based tiles) but it can be changed as required.
Cycle #
One or more of these tiles can be added to a view. The tile will cycle through up to 20 configured fields (limited to two fields only on a Wallboard view). Only one statistic will be visible at a time.
The foreground color of each statistic added can be configured separately so they can be distinguished from each other.
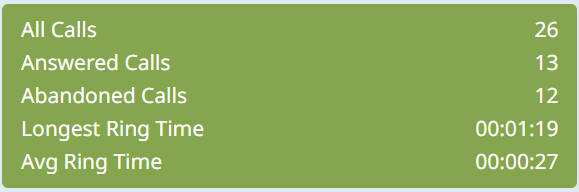
Multi-Stat #
This tiles can be configured with one or more statistics. If a filter is applied to the tile, it is applied to all statistics on the tile.
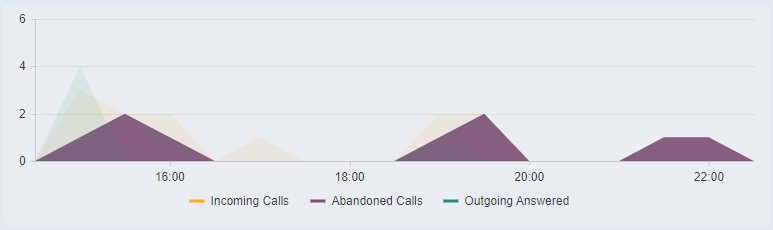
Stats by Time Chart #
The chart tile plots call data over time. The time interval and time span for the grid can be updated on a tile-by-tile basis.
Grids #
Grids provide a data more detailed information either of a call or summarized information based on a user/agent or queue. Where licensed, they also allow the user to interact with subject, such as:
- Making Calls (User/Agent grids)
- Control Agent State (Agent grids)
- Silent Monitoring / Whisper / Barge-In (Agent grids)
Filtering
Normal filtering is not available on the User, Agent and Queue grids. Instead, display filter can be used to show only the specific entities required on the grids.
Grid Limits
Grids are limited to showing 100 rows of data. If you have more than 100 Users/Agents etc on your system, the grids will need to be filtered to show a subset of data.
If the data returned is being restricted by the grid's row limit, a warning triangle will appear in the bottom right of the grid.

Apply a user, queue or group filter as appropriate to reduce the dataset returned by the grid.
Unreturned Calls Grid #
This grid is an extension of the unreturned abandoned calls report. It provides an up to date list of unreturned calls, an important list of customers who have yet to speak to a company representative.
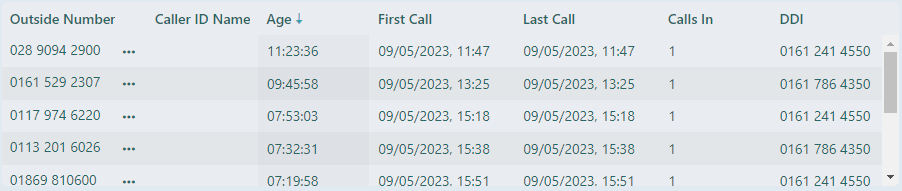
The grid can be filtered as required to show calls for specific DIDs.
As soon as a caller has been called back or they have called back in and been spoken to, the call will automatically be removed from the grid.
info
The Unreturned Calls Grid is based on the (no filter) version of the report. This means if a filter is applied to the grid, it will only filter the incoming aspect of the call and will not be applied to any return calls. When comparing to a historical report, look at the 'Call List (Unreturned Abandoned Calls - no filter)' template.
tip
The Unreturned Calls Grid groups calls from the same number together if they haven't been returned. When comparing to an unreturned call report, take this into consideration.
User Grid #
This provides details of the current state of all users on the system along with summarized data of call involvement. When viewing with a 'Live Analytics' license, details of the current call each user is on is also visible.
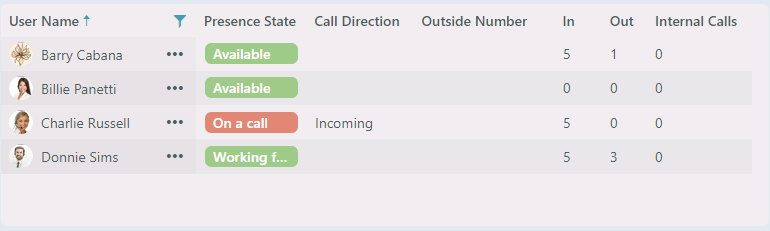
User states are shown as Available, On a call or Not Available.
| Example State | Description |
|---|---|
 |
Available state. This indicates the user is available to take calls. |
 |
On a call state. This indicates the user is currently on a call. |
 |
Unavailable state. This indicates the user is unavailable to take calls. |
 |
Unavailable custom state. This indicates the user has selected a custom status and is unavailable to take calls. |
Agent Grid #
Like the user grid, the agent grid shows a list of users, but only those that are configured as ACD Agents on the system. Additional ACD fields are available on this grid along with agent control for logging agents in/out or changing their status between Ready and Away.
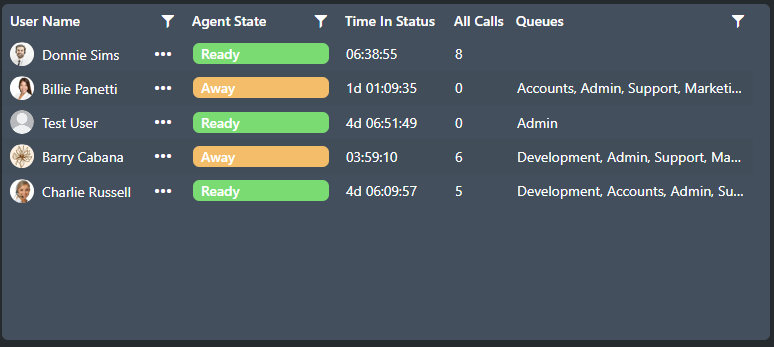
Agent states are displayed on the grid instead of device status.
| Example State | Description |
|---|---|
 |
Ready/Available state, the agent is logged in and available to take calls. |
 |
Busy state, the agent is logged in and is currently on a call. It is not a call that has been distributed to them. It could be a pickup, a direct dial, outgoing or a received transfer etc. |
 |
Busy (ACD) state, the agent is logged in but not available to take calls because they are on a call that has been distributed to them. |
 |
Away/DND state, the agent is logged in but not available to take calls because they have set themselves to 'Away' or 'DND'. Where available, custom away messages set by the agent will be displayed here. |
 |
Busy (Custom) state, the agent is logged in and on a call but has changed their state during that call or are in a custom away state to provide more information about the call they are on. For example, if an agent is making a manual outgoing to call, the custom away state shows while they are busy to provide content as to why they have made the call. |
Silent Monitor (Eavesdrop)
If the supervisor user accessing the Dashboard is also an agent and is logged in, they will have the ability to silently monitor other users on the system.
Once monitoring another user, the options for 'Whisper' and 'Barge-In' are available. Toggling these options allows the monitoring audio stream to be changed:
- Monitoring - The supervisor can hear both parties of the monitored call, but cannot take part in the conversation.
- Whisper - Allows the supervisor to talk to the monitored users, without the remote caller hearing.
- Barge-In - Adds the supervisor to the call so that all parties can hear each other.
To disable a feature, request it again on the context menu to drop back to the monitoring state.
tip
If you are using an Agent Grid and the monitor or agent status controls are grayed out, check you are configured as a 'Manager' within the call center app and that you are logged in as an agent.
info
If you are using an Agent Grid and the monitor or agent status controls are not visible, this is usually due to it not being a supported feature on your communications platform.
info
3CX Agent States
On the 3CX platform, if a users changes to an 'Away' state with their 3CX client, the 3CX platform will show the user as logged out of the queues. To maintain compatibility across all platforms, ~.Dimensions.~ continues to show the users as logged in but in an Away state, to correctly reflect what is happening.
Due to this reason, when comparing the number of logged in users between 3CX and ~.Dimensions.~ statistics, there may be differences.
Queue Grid #
These grids provide information on each of the ACD queues configured. For each queue, call and service level information can be displayed to allow easy monitoring of performance.
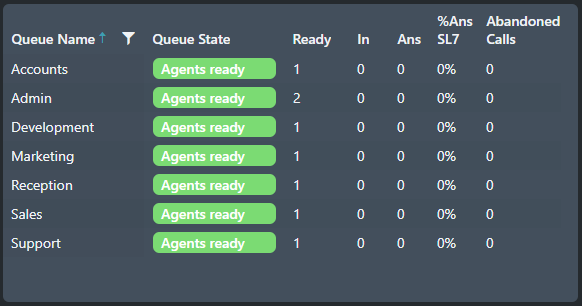
The Queue State field provides a quick view of agent availability and demand:
| Example State | Description |
|---|---|
 |
Agents ready state. This means there are agents logged in and available to take calls. |
 |
No agents ready state. This means that there are currently no agents available to take calls in the queue. This could be because no agents are logged in, or because they are all on calls or in the 'Away' state. |
 |
Calls waiting state. This indicates that there are calls queueing on the group waiting to be answered. This could be because no agents are logged or all are busy/away. The number of calls queuing will be listed in the status. |
info
The Queue State field is only available when accessing the grid using a Contact Center Supervisor role.
note
Although Ring Group information can appear on the Queue based reports, the Queue Grid is specifically for ACD queues and will not display ring groups.
Image #
One or more image tiles can be added to a view. Each image tile can display a single linked image, simply update the tile properties with the URL of the image to be displayed.
info
Image Formats
The image tile will be limited by the image formats supported by the browser being used to view the Dashboard/Wallboard.
warning
Depending on the image being displayed, there may be specific license requirements from the content provider. It is up to the customer to ensure they are licensed correctly to display any content they choose to add to the image tile.
Ticker #
A single ticker tile can be added to a view. The ticker can have up to 20 pieces of information added to it.
Each piece of information added to the tile will scroll along it in the order it was added. If there are a large amounts of data on the ticker it may not be possible to see all pieces of information at the same time.

Video #
A single video tile can be added to a view. The tile is designed to support video content and will play the linked video in a continuous loop. Simply paste in the URL of the specific video into the tile properties.
info
Video Formats
The video tile supports MP4 videos files.
warning
There may be specific license requirements either in the form of a 'TV License' and/or in the form of a license from the content provider. It is up to the customer to ensure they are licensed correctly to display any content they choose to add to the video tile.
-
The tile supports filtering, but filtering is not available when using am Insights Supervisor role. ↩︎
-
Status data is restricted by Customer/Supervisor role level. Please refer to the Statistics section for more information. ↩︎
-
The Queue grid is available using an Analytics/Live Analytics Supervisor role, but the active call stats and queue state fields are restricted to the Contact Center Supervisor role. ↩︎