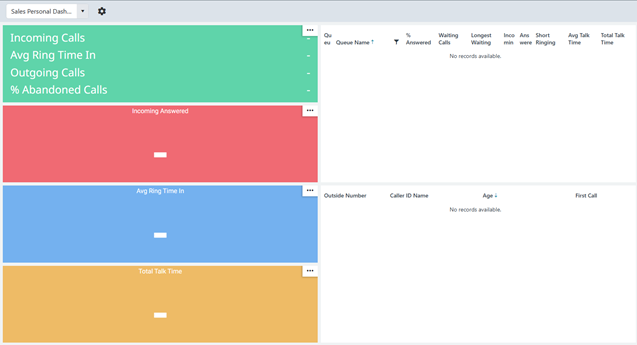
Personal Dashboard #
The Personal Dashboard is a cut-down version of a full dashboard that is designed to be used by individual users. It provides details about the user's own performance and allows them to track their progress against KPIs.
One or more Personal Dashboard views can be configured within a Workspace, allowing different users to access different configurations if required.

If you have permission to manage them, you will see the Personal Dashboards option within the Workspace menu along with Dashboards, Filters etc.
Within the Personal Dashboard editor, you will see 4 statistic tiles on the left and 2 grids on the right (Queue and Unreturned Calls).
info
A user must have the Configure Personal Dashboard permission to configure the Personal Dashboard views.
tip
Visibility of each element to the user is controlled via Client Profiles.
Tiles #
Each view can display up to 4 statistics tiles with up to 4 statistics on each tile.
The statistics displayed on the tiles can be configured to show the data that is most important to the user. The first tile can have any filter applied to the statistics it contains, the remaining 3 tiles are restricted in that they must have a 'Contextual Filter' appied to them.
| Tile No. | Supported Types | Filtering | Alarms |
|---|---|---|---|
| 1 |
|
All | Yes |
| 2 to 4 |
|
Contextual Only | Yes |
By default, when creating a new Personal Dashboard view, the tiles will be created as a Multi-Stat List followed by 3 Single Stat tiles.
The first tile can be edited and the statistics customized to meet requirements. Tiles 2 to 4 can be deleted and replaced with a different supported type of tile if required.
Contextual Filtering #
So that the Personal Dashboard shows data related to the user looking at it, a 'Contextual Filter' must be used.

| Filter Type | Description |
|---|---|
| Current agent | The agent looking at the dashboard. This will exclude calls that were made when the user wasn't logged in as an agent. |
| Current user | The user looking at the dashboard. This will include all calls the user was involved in. |
| Queues assigned to | The queues the user is a member of |
| Queue logged in to | The queue the user is currently logged into |
Once a contextual filter is selected, it can be supplemented with additional filters to further refine the data shown on the tile.
note
Tiles 2 to 4 must have a contextual filter applied.
Alarms #
| Alarm Type | Supported Tiles |
|---|---|
| Flash tile |
|
| Raise browser notification |
|
| Change background color |
|
| Change text color |
|
| Play sound |
|
Unreturned Calls #
This grid shows the user a list of calls into the business where the caller never got answered and has not called back in. This can be useful for users to see if there are any calls and need to follow up.
Queue Grid #
If the user also has an 'Agent User Add-On' role, they can see the Queue Grid on their personal dashboard. This will show them the current status of queues that they are a member of.
The queue grid is designed to provide agents with information about the current status of queues, whether there are customers waiting and whether the business is hitting performance targets.
As with the full Dashboard, the Queue State field provides a quick view of agent availability and demand:
- Green - There are agents logged in and available
- Amber - There are no agents available
- Red - There are no agents available and there are calls queuing