Viewing Reports #
The following sections cover the report viewer interface and explain how to re-format a report, change the date range or apply a filter.
Report Interface #
The report view displays a completed report in a grid format.
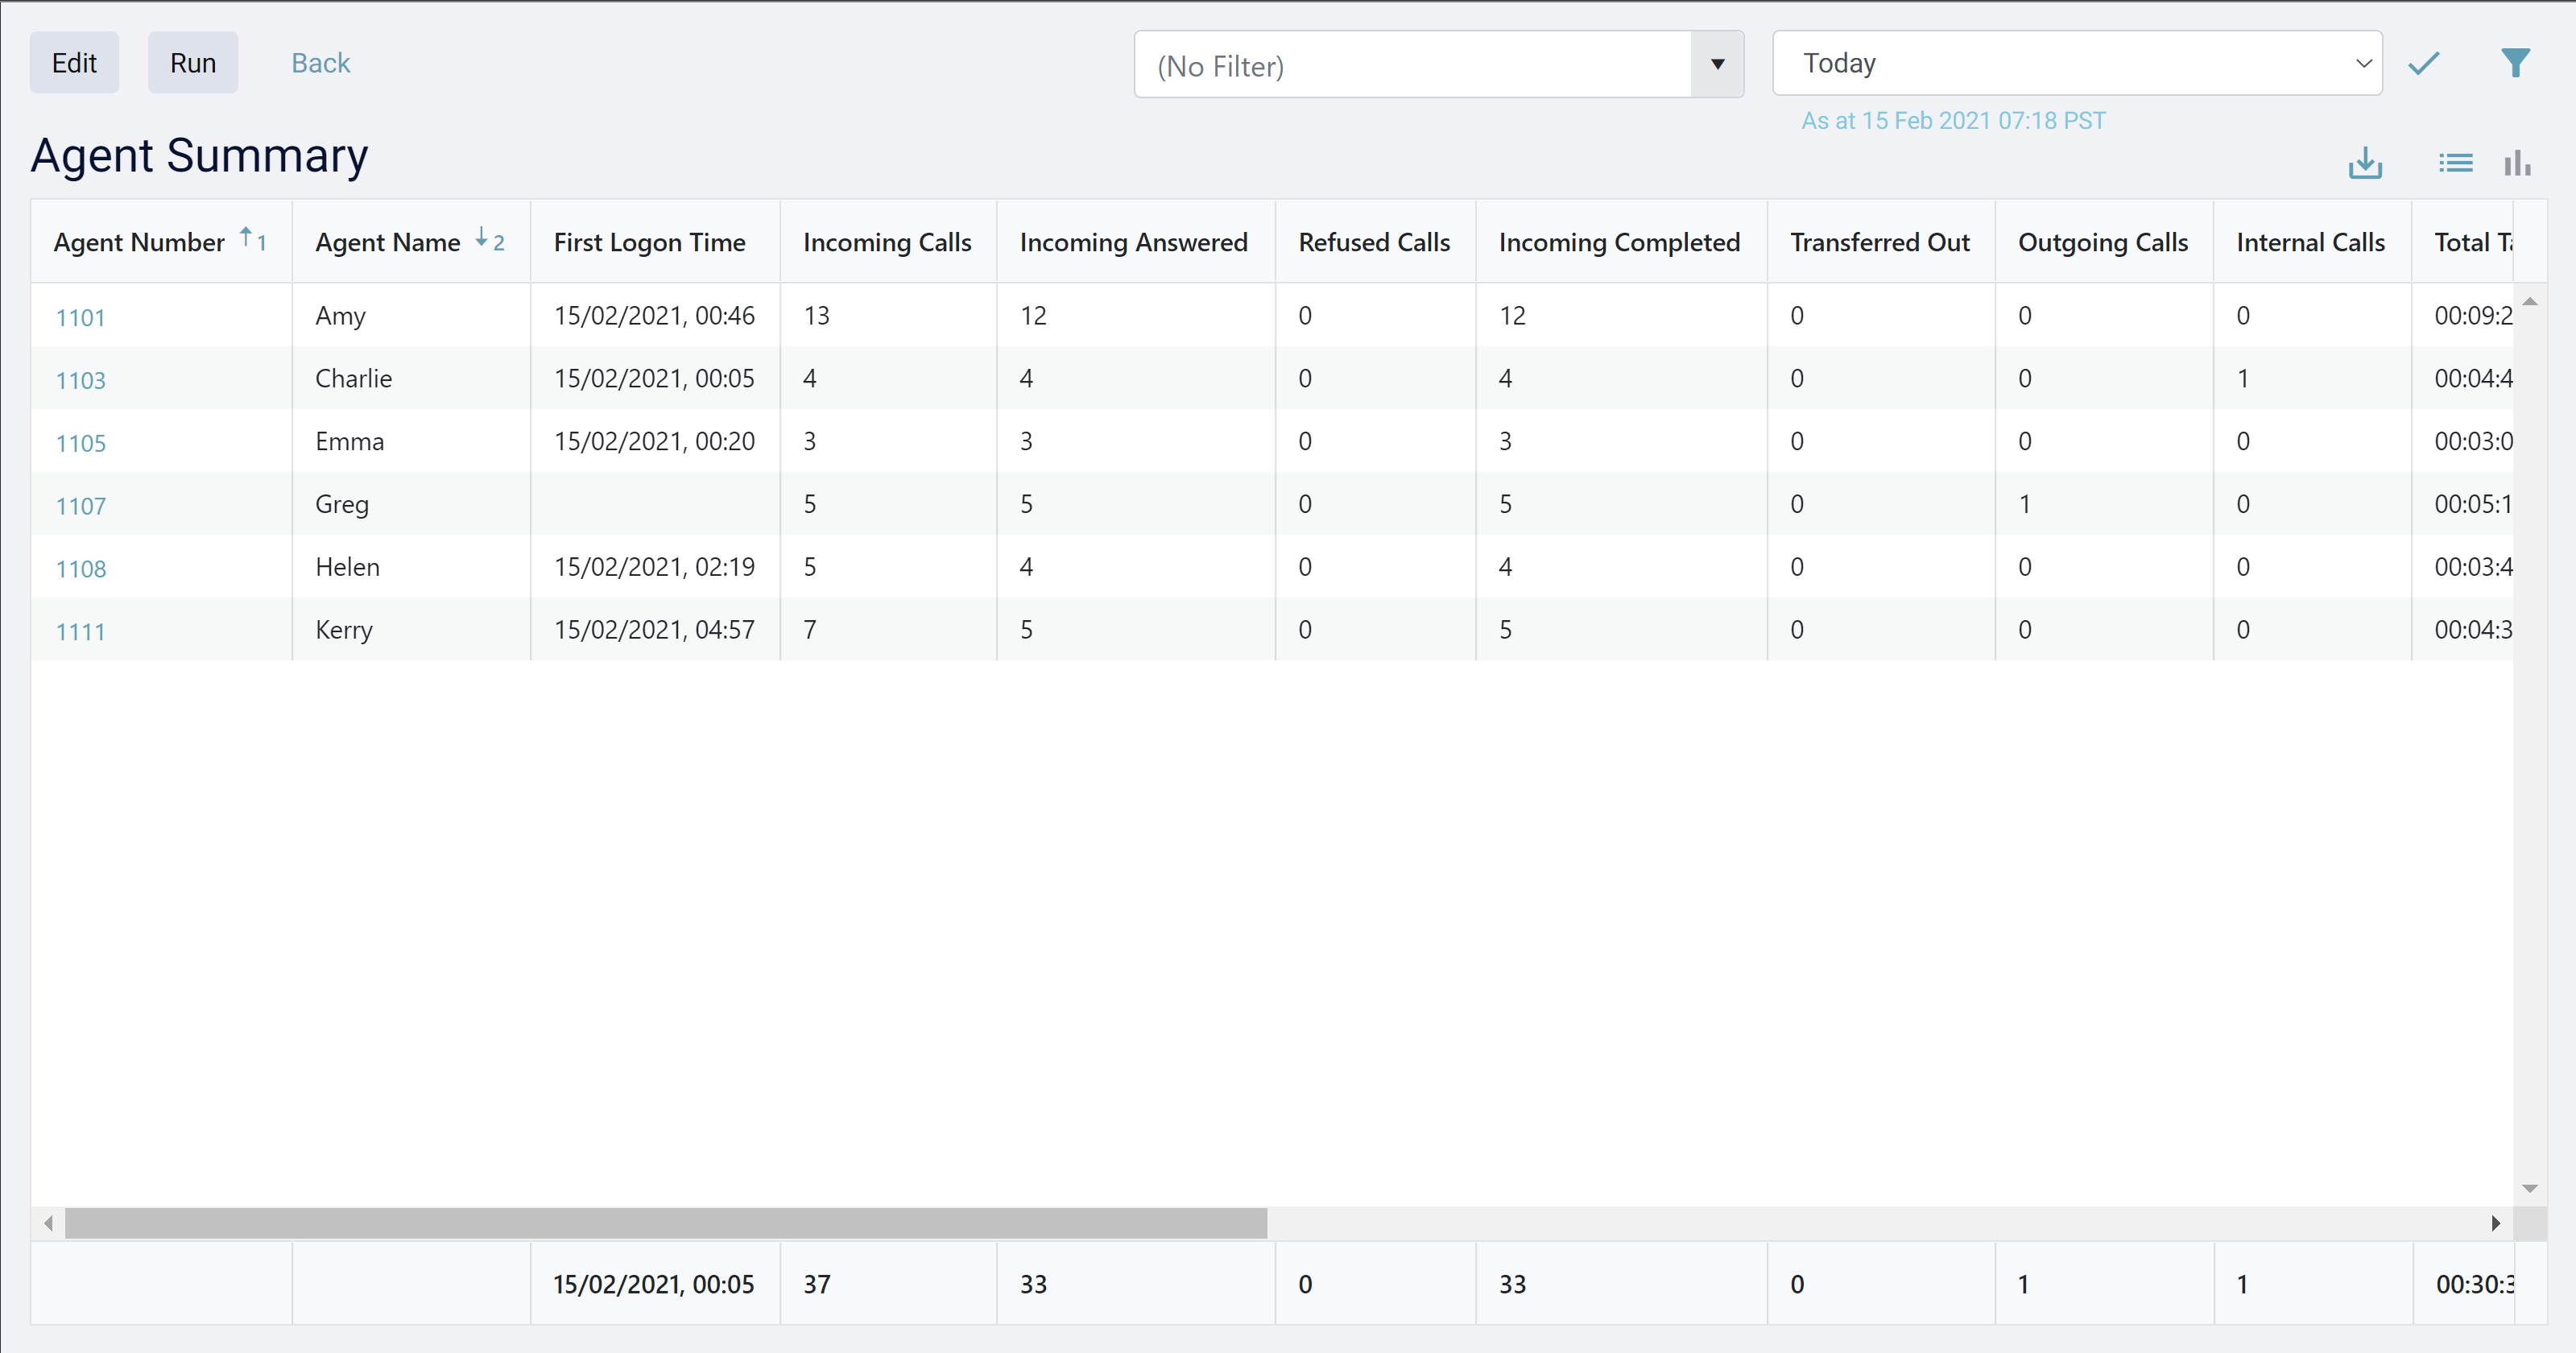
Each of the fields specified in the report's configuration are displayed in the order defined. For more information on the data displayed in a particular field, hover the mouse over a field heading to display the field's description.
Example tool-tip for the 'Total In (Inc. IC)' field:
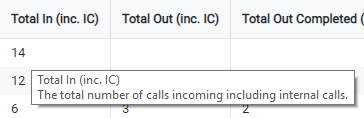
info
When a summarised report is being viewed, a 'Summary' row containing totals (where relevant) will be displayed along the bottom of the report.
Ordering/Sizing Fields #
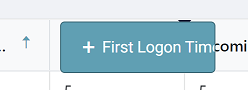
Fields can be resized and reordered as required. To resize, click on the header divider to the right of the field to resize. As the field size is changed, the field name will alter.
Fields can be reordered by clicking anywhere on a field's header and dragging/dropping the field to a new location.
Any changes to the size and ordering of the fields will be saved against the report so that they are used the next time the report is run.
Sort Order #
When a report is first opened, the sort order from the report's definition is used. The field currently being sorted on and the sort direction is visible as an ascending or descending arrow:
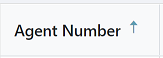
To change the sort order simply click on he heading of the field you wish to sort by. To toggle the sort direction, click on the heading again. The arrow should change direction along with the sort order.
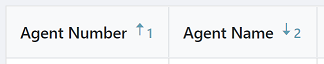
If sorting on multiple fields has been applied then multiple sort arrows will be shown along with a number indicating the order of sorting.:
Date Ranges #
The date range controls the time period over which the report analyses calls. The date range control can be found in the top-right of the report viewer:
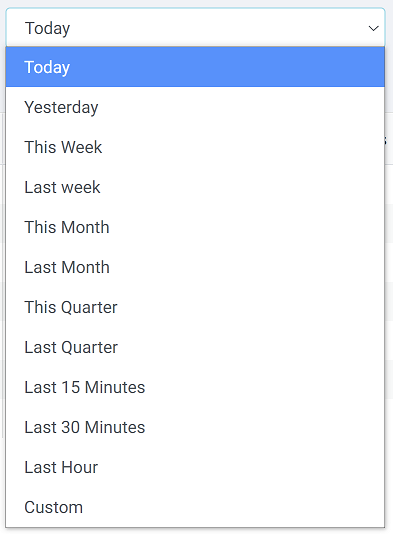
The most commonly used date ranges are contextual ones (Today, Yesterday, This Week etc.). Using contextual date ranges means the report will always be relevant to the time which you run it and saves time reconfiguring reports.
note
The dates displayed in the report and the dates used in filtering are dates/times local to the user accessing the system. If a call was made at 10am EST it would be displayed as 9am to someone viewing a report in the CST time zone.
To run the report over a specific date/time range, select 'Custom' from the date range picker. This will open the advanced filtering panel and will allow a specific date and/or time range to selected.
tip
Remember to press the 'Apply Filters' button to refresh the report after changing the date range.
info
Running a report over a larger date range will take longer. Being more specific with a date range can reduce the report run time.
Click Through #
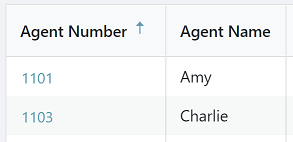
The Click-Through feature provides access to view the call data which has been used to generate the report. Where Click-Through is available, the fields in the first column of a report are displayed as a hyper-link:
On a grouped report, clicking on the hyper-link on a specific row will open a new report showing the data used to construct the grouped report. In most cases this will be a Call List, but on location based reports you can click through from country to state to area code as required.
On a Call List report, clicking on the hyper-link on a specific row will open up the Call Session View, showing all segments of a call and providing recording playback features if available.
Filtering #
Filters can be used to restrict the calls that a report analyses, ensuring that only relevant data is displayed on the screen.
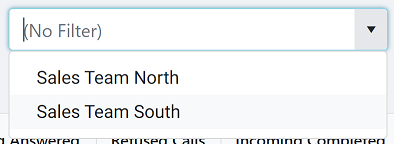
Existing workspace filters can be applied to a report using the filter selector:
tip
Remember to press the 'Apply Filters' button to refresh the report after changing the filter.
To apply an ad-hoc filter on the fly, click the filter icon ( ) to open the advanced filtering panel.
From here, filter conditions such as specific phone numbers or users can be quickly applied to a report without having to create and save a filter.
) to open the advanced filtering panel.
From here, filter conditions such as specific phone numbers or users can be quickly applied to a report without having to create and save a filter.
For more information on creating filters, please refer to the Filters section.
Exporting #
Reports can be exported in Microsoft Excel format if required. Simply click the Export icon ( ) and a download will be initiated from the browser.
Depending on the browser being used, the export will be saved to the default downloads location or a location will be prompted for.
Switching View #
As well as grid view, the reporter viewer provides a view toggle to switch between grid and chart view:
Please refer to the Charts section for more information.