Managing Dashboards & Wallboards #
This section outlines the settings available to customise a dashboard/wallboard view with new tiles, filers and colours.
Tiles #
Each view can be customised with a range of supported tiles to display the information required. Depending on workspace permissions, users can add and remove tiles, change the appearance, filter and relocate tiles at any time.
info
Up to 64 tiles can be added to a view.
Adding/Editing #
Before tiles can be added or relocated, the view must be unlocked. This is to prevent the accidental moving of tiles during normal viewing.
The padlock icon on the options menu shows whether the view is currently locked and can be used to toggle the lock status on and off.
Locked view:

Unlocked view:
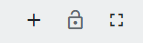
Once a view is unlocked, the '+' icon can be used to add a new tile to the view. When clicked, the 'New Tile' selection form will be presented. Each view supports a range of different tile types. Refer to the Tile Types section for more information on each type.
To complete the process of adding a tile, select one of the available fields to display and then click 'Save'. Refer to the Dashboard/Wallboard Fields section for more information on each of the fields and what data they display.
The tile will have automatically been added to the view with a randomly selected text and background colour.
info
For non-statistic tiles such as image or video, the tile creation process will involve providing a link to the media content to display.
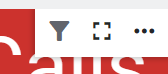
To change the properties of the tile or to add an alarm, the tile must be edited. Hovering over a specific tile will display the tile's option menu:
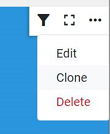
To edit a tile, select the more (...) icon then click the 'Edit' link on the menu to load the tile 'Edit' form:
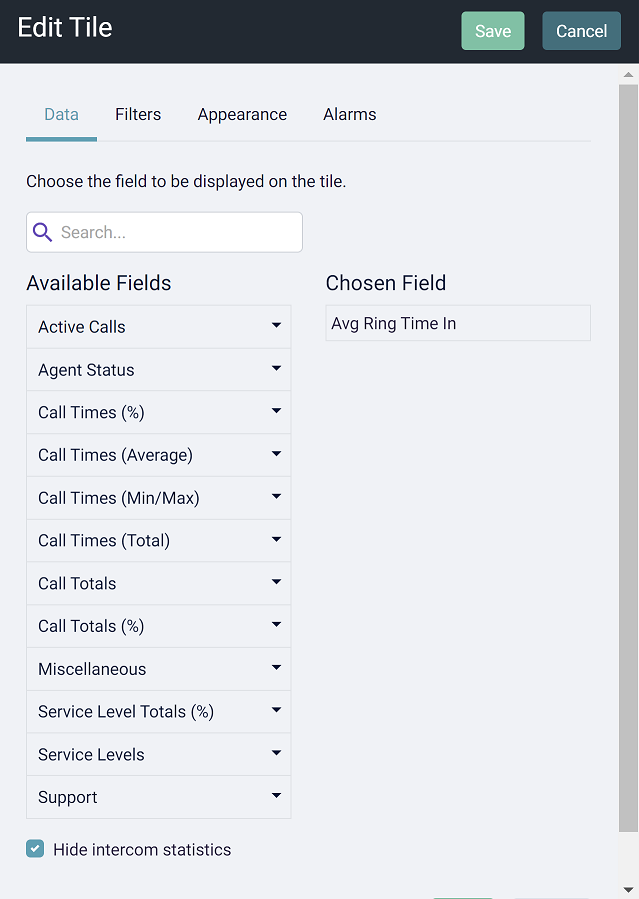
Using the 'Edit' form, the tile appearance, statistics, filters and alarms can all be changed.
Cloning Tiles #
To help when configuring multiple tiles which require a similar configuration, the 'Clone' option can be used. On the source tile, select 'Clone' from the options menu to open the 'New Tile' form, pre-populated with the configuration of the source tile.
Make any changes required and then press 'Save' to add the new tile to the view.
Filtering #
Most tiles on a view can be filtered so that the information displayed is meaningful to the users. Workspace filters can be applied to a tile when the same filter is going to be applied to multiple tiles on the system. For adding a filter specifically for this tile, use the quick filters.
For example, a tile display the 'Longest Waiting' statistic could be filtered for a specific DDI or queue so that it is obvious to users where a call is queuing and what they can do about it.
Tile filters can be applied when editing the tile or by using the filter selector on the tile options menu:
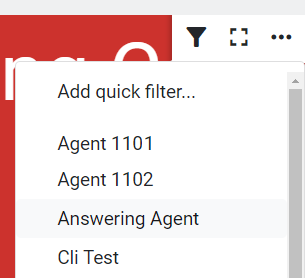
Choose a workspace filter from the drop-down list or select 'Add quick filter' to navigate directly to the filter tab on the tile's edit form.
For more information on using filters, please refer to the Filters section.
note
Users with the 'Member' permissions on the workspace cannot currently apply filters to tiles in the same way they can on reports. To edit filters, users require the 'Contributor' role.
tip
Adding an agent/user-based filter to a tile may change the statistic to be calculated using segmented data (instead of the default non-segmented). For more information, please refer to the Call Segmentation section.
Grid Filtering #
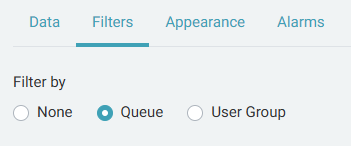
Grid tiles do not support normal filtering, and will show all data relating to the user, agent or queue being displayed. Grid tiles do support display filtering, to limit the number of rows that are rendered on the view.
The image below shows an example of the 'Agent Grid' filter, allowing the agents displayed to be restricted to one or more Queues or User Groups.
Model by Call Sessions/Call Segment #
The data displayed on a tile can be look at a call as a whole or at a specific segment of a call. Which model of the data you choose will depend on how the data is being filtered and what you would like to see.
Refer to the Modelling by Session/Segment section for more information.
Full Screen Tiles #
Individual tiles can be made full screen, either manually by using the full-screen toggle icon on the tile or automatically by configuring an Alarm.
note
Tiles can also be toggled in and out of full screen by double-clicking
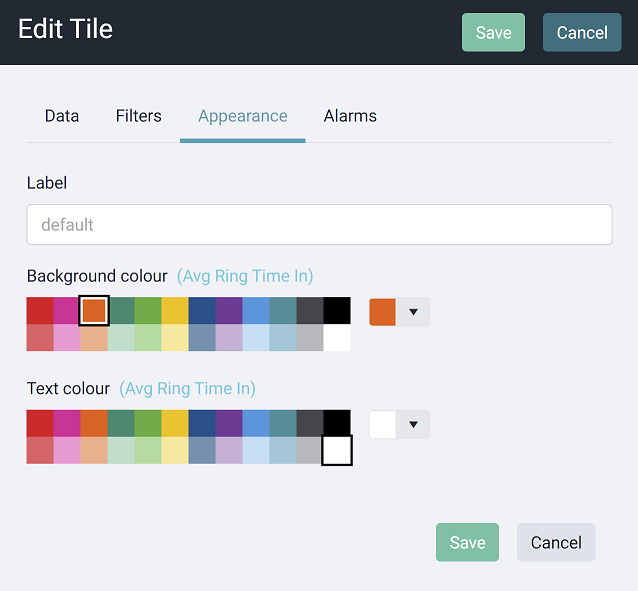
Appearance #
The background and text colour on tiles can be configured and changed as required, either by selecting from one of the predefined colours or using the custom colour selector.
When editing a multi-stat tile (e.g. Ticker \ Dual-Stat Cycling), the text colour for each statistic can be selected.
The colour picker for the Dashboard and Wallboard vary. The Wallboard provides a broad range of fixed colours. The Dashboard has a reduced set of colours based on the Colour Palette that has been selected for the view.
whether using a dashboard or wallboard, a custom colour can always be selected using the drop-down picker at the side.
Alarms #
Each of the statistic-based tiles (not image or video) support the alarms feature. Alarms are user defined conditions which can be used to get attention when there is problem with service levels or performance.
Refer to the Alarms section for more information on configuring tile alarms.
Location #
By default, tiles will be displayed in the order they are added to a view. This can be changed at any time.
To change a tile's location, unlock the view then left-click a tile and drag it to a new location. The other tiles in the view will all shift along one to make way for the new tile.